 Skip to content
Imagine building a skyscraper, designing a car, or even making a smartphone component without knowing how the material behaves under load. The stress-strain curve is the tool that makes all of this possible. It reveals how a material reacts when forces are applied, and it gives engineers the insight needed to ensure performance, reliability, and safety in real-world applications.
Stress is the force applied per unit area, and strain is the deformation caused by that force. Together, these two concepts form the foundation of the stress-strain curve. To get this curve, engineers conduct tensile tests, where a sample of material is pulled with steadily increasing force until it breaks. The resulting data—stress versus strain—is plotted as a curve that tells the story of how the material behaves under load.
Key Features of the Stress-Strain Curve
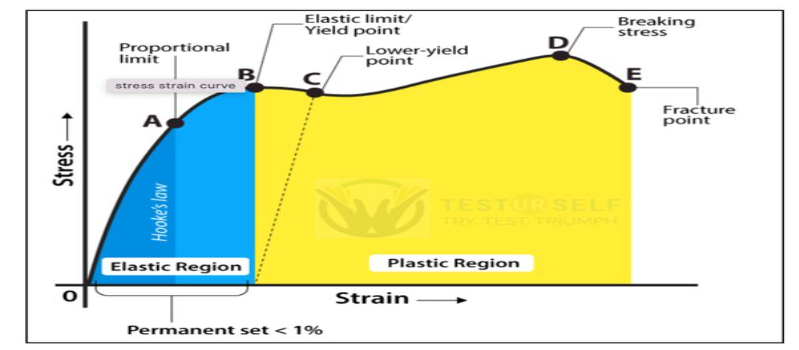
The stress-strain curve is divided into distinct regions, each with its own meaning:
- Elastic Region – At the start, the material stretches but returns to its original shape once the force is removed.
- Yield Point – The moment when permanent deformation begins. Beyond this, the material won’t return to its original dimensions.
- Ultimate Tensile Strength (UTS) – The peak of the curve, showing the maximum stress a material can endure before necking starts.
- Fracture Point – Where the material finally fails and breaks apart.
These regions allow engineers to predict how materials will behave—from the first signs of stress all the way to catastrophic failure.
Stress-Strain Behavior of Different Materials
Not all materials behave the same way under stress, and their stress-strain curves highlight these differences:
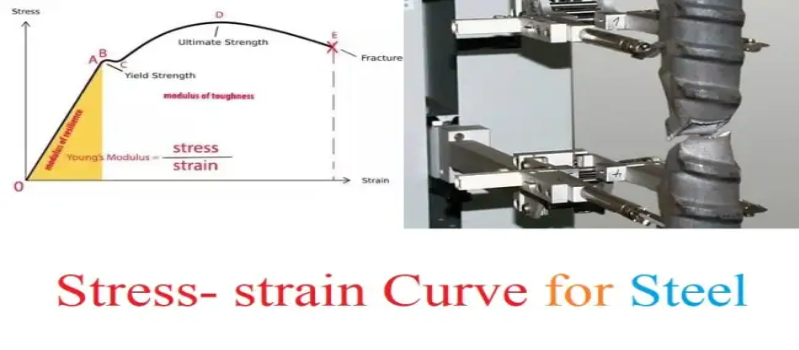
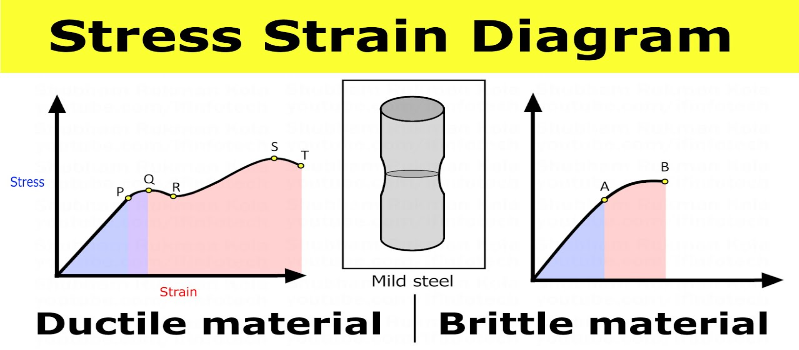
- Metals – Show a clear elastic region, yield point, and significant plastic deformation before failure, making them predictable and reliable.
- Polymers – Often display nonlinear curves, with large stretches of deformation and no sharp yield point, reflecting their flexibility.
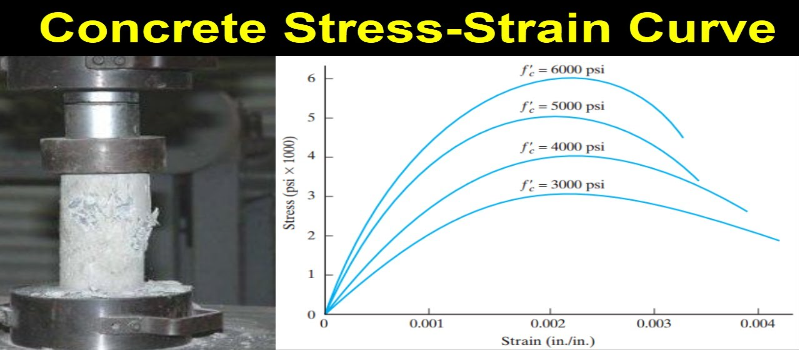
- Ceramics & Composites – Typically brittle, with very little plastic deformation before breaking, but they excel in hardness and wear resistance.
Understanding these differences is crucial when selecting materials for specific applications.
Why Stress-Strain Curves Matter in Engineering
The stress-strain curve is not just a lab exercise—it’s a design tool. Engineers use it to:
- Select Materials – Choosing metals for aerospace where high strength-to-weight ratios are critical, or polymers for flexible consumer goods.
- Design with Safety Factors – Ensuring that working stresses are well below the yield strength to prevent permanent damage.
- Predict Failures – Understanding how and when a material will fail allows for better maintenance planning and safer structures.
From airplanes to bridges, the data from stress-strain curves directly shapes design decisions.

Testing and Measurement
A stress-strain curve is created with a universal testing machine (UTM). The machine applies force at a controlled rate while precisely measuring how much the material stretches. The result is a detailed curve that shows the entire journey of the material—from elastic behavior to fracture.
The accuracy of this data is critical. Engineers rely on it not only for academic knowledge but also for compliance with strict industry standards in aerospace, automotive, and construction.
Material Toughness and Energy Absorption
One of the most important insights from a stress-strain curve is the area under the curve, which represents the toughness of a material. A larger area means the material can absorb more energy before failure. This is why metals like steel are used in crash-resistant car frames, while brittle materials like ceramics are avoided in impact-heavy applications.
Conclusion
The stress-strain curve is more than a graph—it’s a blueprint for understanding material behavior. It tells us when a material will deform, how much load it can take, and how it will ultimately fail.
By studying these curves, engineers can select the right materials, design safer structures, and create products that last longer and perform better. Whether it’s the steel in a bridge, the composites in an aircraft, or the polymers in everyday electronics, the stress-strain curve ensures that materials do their job reliably—every time.


2 Responses
Your blog enlivens my day like a ray of sunshine. Thank you for spreading positivity through your words.
Your commitment and enthusiasm shine through in every section. It’s truly inspiring.